Lodestone Analytics installs a governed Excel Control Room on the data you already have. Your leadership team runs the week from one screen: the binding constraint named, the loss costed in dollars, an owner against every action.
Built by a Chartered Accountant with three decades in manufacturing and mining · Six Sigma · Lead ISO Auditor
Plant 1 Control Room: OEE and downtimeLines 1–4Weeks 1–12Example data
Binding constraint
Line 1 bearing failures
34.9% of 57.8 lost hours. 1,212 minutes across 5 events. Measured from the downtime log, not assumed.
Cost of the top loss, this period
AU$116,352
Unplanned stops are 72.4% of all downtime.
Owner
Maintenance Lead
Next action: PM overhaul on Line 1, due Friday.
Plant OEE
71.4%
target 85.0%
Availability
86.5%
A
Performance
90.4%
P
Quality
91.3%
Q
Gap to target
13.6
points
Plant OEE by week: the week 3–4 bearing failure and the recovery
Downtime Pareto: 57.8 h, 48 events
Bearing / mechanical34.9%
Changeover / setup18.9%
Material shortage11.9%
Speed loss / minor stops11.0%
Quality hold / rework8.9%
FailLine 1 OEE 68.4%. Bearing failures are the #1 loss: 1,212 min across 5 events.Maint. Lead
At riskUnplanned share 72.4% of downtime. The top reason alone costs AU$116,352 this period.Plant Mgr
On trackLine 3 PM standard signed off. It rolls to Line 1 next week.Ops Mgr
LA-OPS-A-A02 OEE Calculator v3.1, example refresh 19/09/2026 06:12Next action: PM overhaul, Line 1, due Fri
Example data. An illustrative four-line manufacturer over 12 weeks, not a client’s figures. The layout is the governed output order every install uses: header and filters, KPI band, primary chart, secondary chart and issue register, then the stamp, owner and next action. Read the standard.
46
governed models: 32 operational models across five pillars, plus 14 project finance models
14 days
target install, counted from the day we have access to your data
13
control dimensions scored in the Operational Health Score
1 gate
every model passes a signed QA checklist before handover
Open the workbook.
This is what you get: the real Excel file, not a mock-up. Click through the views of two finished hero workbooks, loaded with demo data for a fictional Perth distributor.
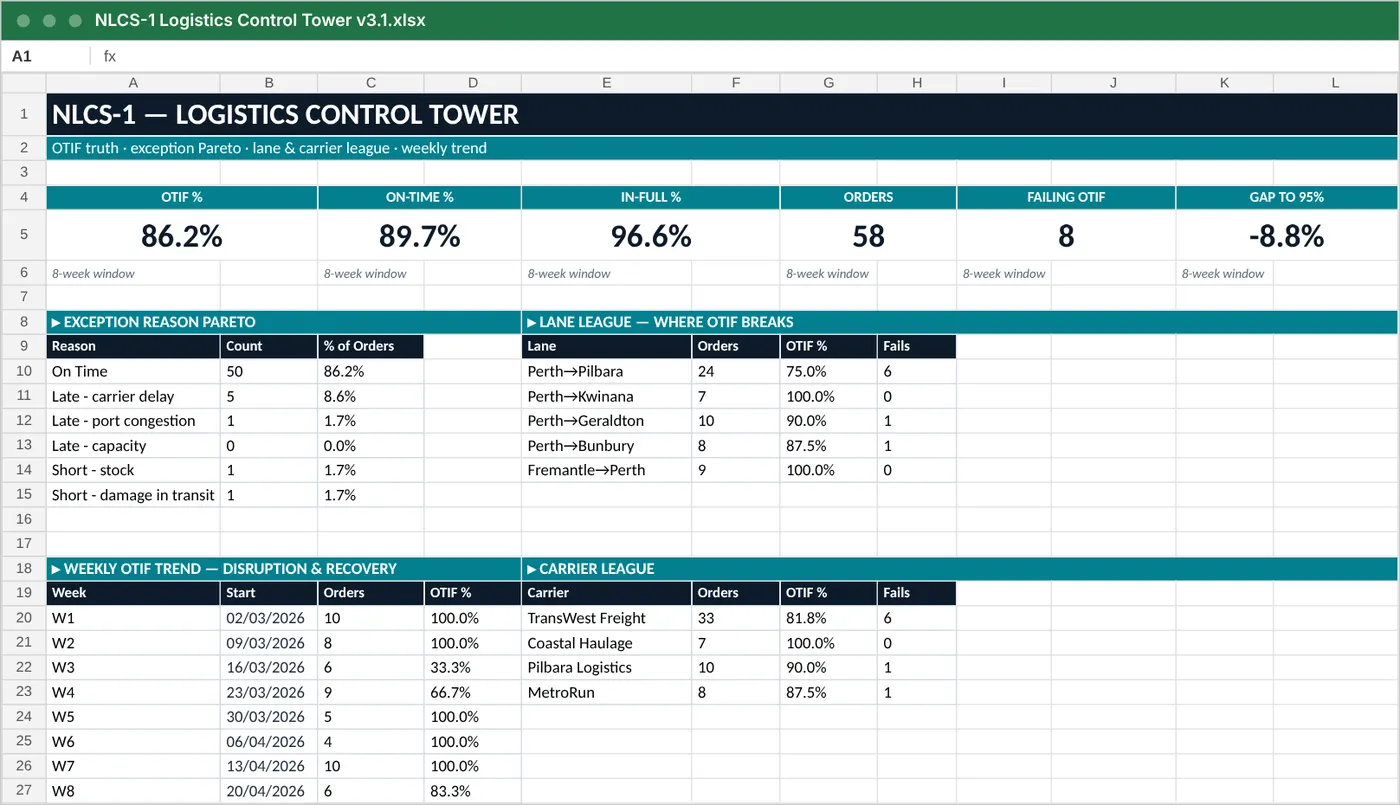
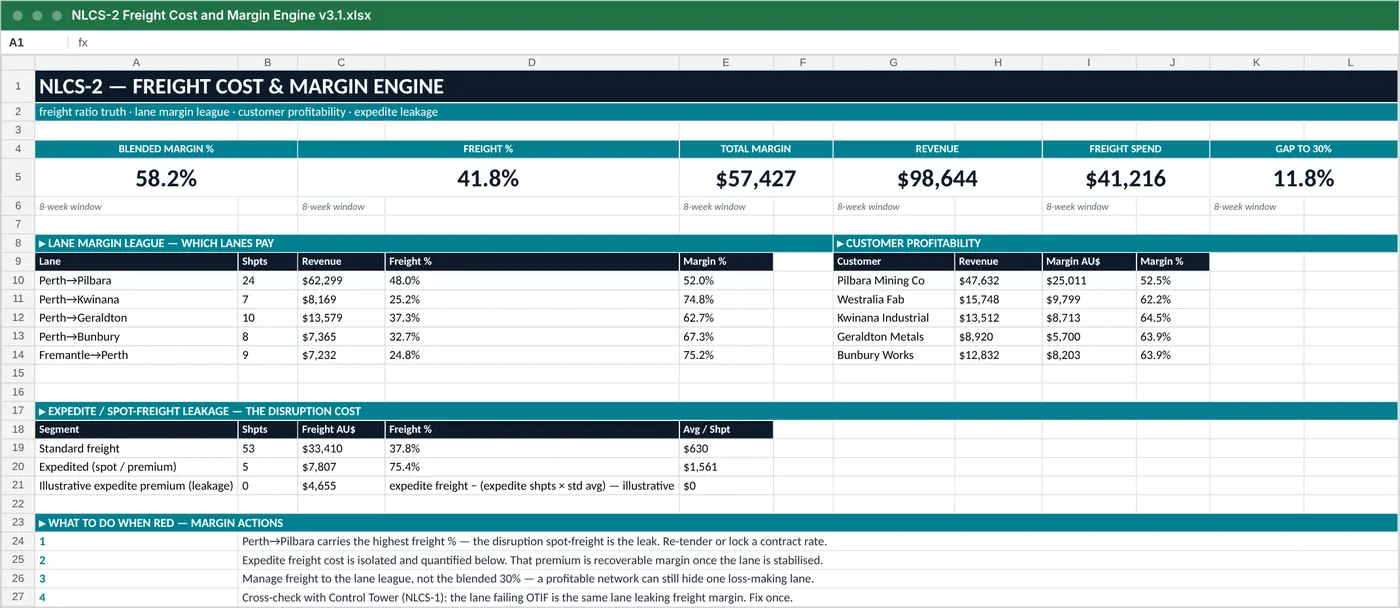
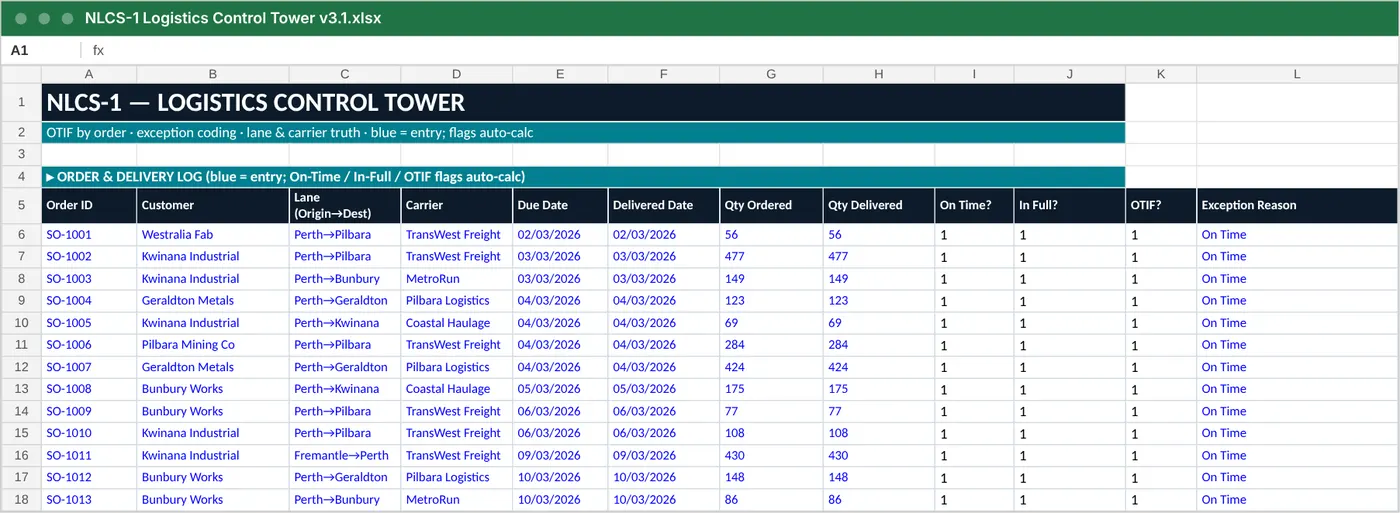
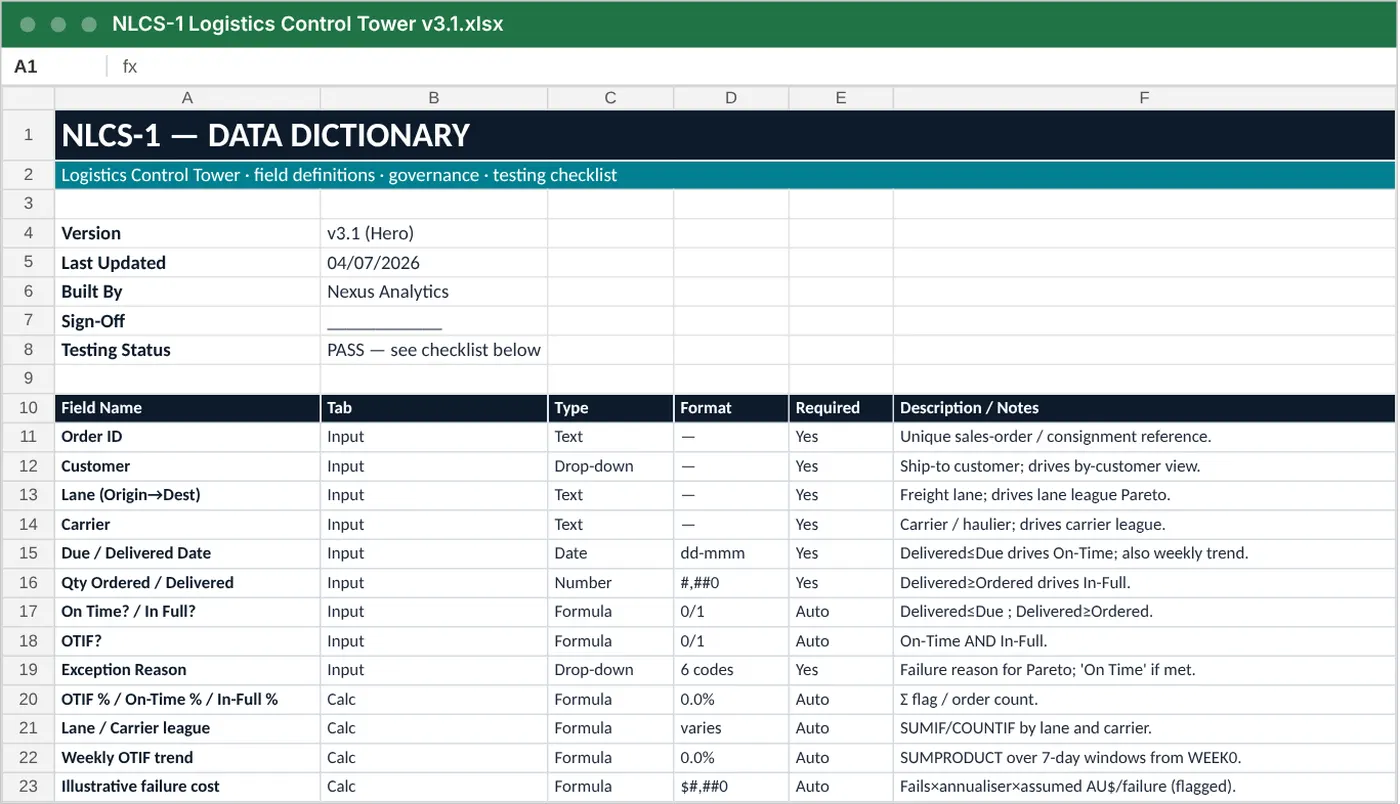
Logistics Control Tower: OTIF is 86.2% against a 95% target, and the lane league shows where it breaks. Perth to Pilbara runs at 75% with 6 of the 8 failures.Freight Cost & Margin Engine: freight is 41.8% of revenue against a 30% target. Expedited shipments average AU$1,561 against AU$630 standard, an illustrative AU$4,655 premium in eight weeks.The input log: one row per order, entry cells only. The On Time, In Full and OTIF flags calculate themselves, so nobody re-keys a status.The data dictionary: every field, where it lives, its format and how it is calculated. It is what lets someone other than the author check the numbers.
Eight weeks at one plant: fix the biggest loss first.
From our manufacturing demo dataset: three lines, three shifts, eight weeks. The Pareto named spindle bearings on Line 2 as the top loss. One PM overhaul in week 4, and plant OEE climbed from 56.3% to 74.0% by week 8.
Plant OEE by week
Plant averageLine 2 (grinding)Lines 1 and 3
Where the 224 lost hours went
Two causes carry 81.7% of the lost hours. That is where the improvement money goes first, not to the loudest problem.
Demo data. Meridian Components is a synthetic dataset built to show how the models read, not a client’s figures. Download the dataset (Excel) and load it into any model.
That one is an example. Now fill yours.
Twenty-five questions, about 10 minutes. Last week’s output, the hours you lost, what a unit really costs, what happens when a number goes red. Your Control Room fills tile by tile as you type. You finish with a control score out of 39, the dollars at stake, the models that fix it, and a PDF report you keep.
Both tools run in your browser. Nothing you type is sent to us.
Output, time and losses fill output vs plan, OEE and the downtime Pareto.
Budget and actual economics build a reconciled price, volume and cost margin bridge.
How you run it writes the issue register, with an owner on every line.
Then act on it your way: one model for AU$500, a configured reporting profile, or the full Control Room for AU$7,500. Prices ex GST.
Three failures sit between your data and your decisions.
None of them is a data problem. All three are control problems, and each has a dollar cost behind it.
Spreadsheet chaos
Eleven versions of the truth, three of them open right now. Nobody is sure which file is current, the logic lives in one person’s head, and one broken link changes the answer without telling anyone.
The bottleneck is assumed, not measured
Everyone has a theory about which line, truck or lane is hurting you. Without a ranked, costed loss breakdown, improvement money lands on the loudest problem, not the largest.
Numbers nobody trusts
Two reports, two answers, and a meeting spent arguing about definitions instead of deciding. Untrusted numbers don’t just delay the call. They train your team to stop asking.
We install control, not another dashboard.
A Lodestone Control System is a decision layer between your data and the way your business already runs: the daily huddle, the weekly ops review, the month-end close. It names what is off track, why, what it costs, and who owns the fix by Friday.
A dashboard reports, then waits for someone to interpret it.
A control system triggers a decision and names the owner.
It sizes the loss in AU$, so the fix can be ranked against every other call on your week.
It runs on a cadence your week already has. No new meeting, no new system to log into.
Three components. One governed system.
Control Room
The one executive view your leadership team runs the week from. RAG status against agreed thresholds, the top losses ranked, the binding constraint named, and an issue register with owners and due dates.
Profit Engine
True cost-to-produce and margin by SKU, customer and lane. The unit economics under the operational picture, so a throughput call and a pricing call finally use the same numbers.
Governance Pack
Data dictionary, version control, reconciliation checks and a signed testing checklist. It is what lets the model outlive its author, and what lets someone other than the author check the numbers.
Most installs start with one of three models.
Each is a complete, governed model on its own, and the first rung of the architecture that runs the full Control Room.
LA-OPS-A-A02
OEE Calculator
Availability × performance × quality by line and shift, with downtime categorised, Pareto-ranked and costed. Answers where the capacity went before Monday’s meeting starts.
LA-OPS-B-B02
Cost-to-Produce Model
Material, labour and overhead resolved to the SKU, with a margin bridge and price-floor tests. Answers which products actually make money. Usually not the ones people assume.
LA-OPS-E-E02
GM Control Room Dashboard
The executive overlay: operational status, unit economics and the issue register on one screen. Answers what needs my attention this week, with an owner already against it.
Five pillars. Colour carries structure, not taste.
A pillar’s colour is fixed on every surface we ship: a deck, a workbook tab, a dashboard, this page. Learn one model and you know where everything else lives.
Capacity, cost-to-produce, demand, inventory policy, workforce, bottleneck and pricing.
7 models
CImprovement & Lean
What to fix
Loss trees, Pareto, root cause, CI pipeline, standard versus actual and banked savings.
6 models
DExpansion & Strategic
What’s next
Capacity expansion, capex evaluation, site replication, product mix and make versus buy.
5 models
EReporting & Control Room
How it’s run
Daily, weekly, monthly and executive views: the cadence layer that closes the loop.
5 models
That is 32 operational models. A further 14 project finance and valuation models make 46. See the full catalogue.
Diagnose. Install. Run.
01
Diagnose
A 30-minute call scores your 13 control dimensions and sizes what is at stake. You get the scored Operational Health Score back within one business day, whether or not you go further.
02
Install
Target: 14 days from data access. Data mapping, build, test, train, go-live. We start on your lowest-scoring, highest-dollar area, so the system starts paying before handover.
03
Run
You run the week on one trusted view, on a cadence that produces decisions and owners. Fourteen days of hypercare, then an optional care plan for updates.
What the first 90 days can look like.
Two illustrative installs, built from typical scenarios and real operating experience. The figures are representative. They are not a record of a named client.
Illustrative case 1: manufacturing
Where the capacity went
Precision components manufacturer, about 85 staff, AU$12M revenue, three lines over three shifts. An under-used ERP surrounded by disconnected spreadsheets. The operations manager could not answer the three diagnostic questions: daily output against plan, true cost per unit, or where the constraint was.
Illustrative before and after, manufacturing
Metric
Before
After 90 days
Plant OEE
62%
71%
Performance visibility
Monthly
Daily
Bearing downtime, Line 2
~100 h/qtr
~28 h/qtr
SKUs priced below 25% margin
3 of 5
0 of 5
Time to build the weekly pack
~6 h
~20 min
Illustrative annual benefit AU$70,000 against a AU$7,500 Control Room: about 1.3 months to payback on these assumptions.
Illustrative case 2: mining and resources
One cost-per-tonne number, weekly
Open-pit gold operation, mid-tier producer, owner-operator fleet. Production sat in dispatch, grade in the lab and cost in finance, so cost per tonne arrived six weeks after the month it described, and the throughput constraint was assumed rather than measured.
Illustrative before and after, mining
Metric
Before
After 90 days
Cost-per-tonne visibility
6 wks late
Weekly
Haul truck availability
78%
85%
Sources to see one number
3 systems
1 view
Downtime ranked?
No
Pareto
Cost per tonne
baseline
−6%
Illustrative annual benefit AU$140,000 against a AU$7,500 Control Room: under one month to payback on these assumptions.
Illustrative. These cases are built from typical scenarios and real operating experience to show the shape of the outcome and the ROI logic. They are not a record of a named client. Figures are representative, and any payback or ROI figure depends on your data and the actions you take.
Governed, testable, repeatable.
Operator logic
Built around the decisions a GM, COO or CFO actually makes on a Monday, not around what is easy to chart.
Engineered like software
Versioned, tested and reconciled against source. Every release carries a changelog and a signed QA gate.
Refreshed, not rebuilt
Power Query pipelines read your existing exports, so next month is a refresh, not a re-key.
Cadence, not just charts
Every install ships the operating rhythm: the agenda, the owners and the follow-up that turn a number into a decision.
Take something useful away.
Free, no form to fill. Use them with your team before you talk to anyone.